Alert fatigue
A team that receives forty alerts a day is not better monitored than one that receives two. It is worse monitored, because nobody is reading them.
A team that receives forty alerts a day is not better monitored than one that receives two. It is worse monitored, because nobody is reading them.
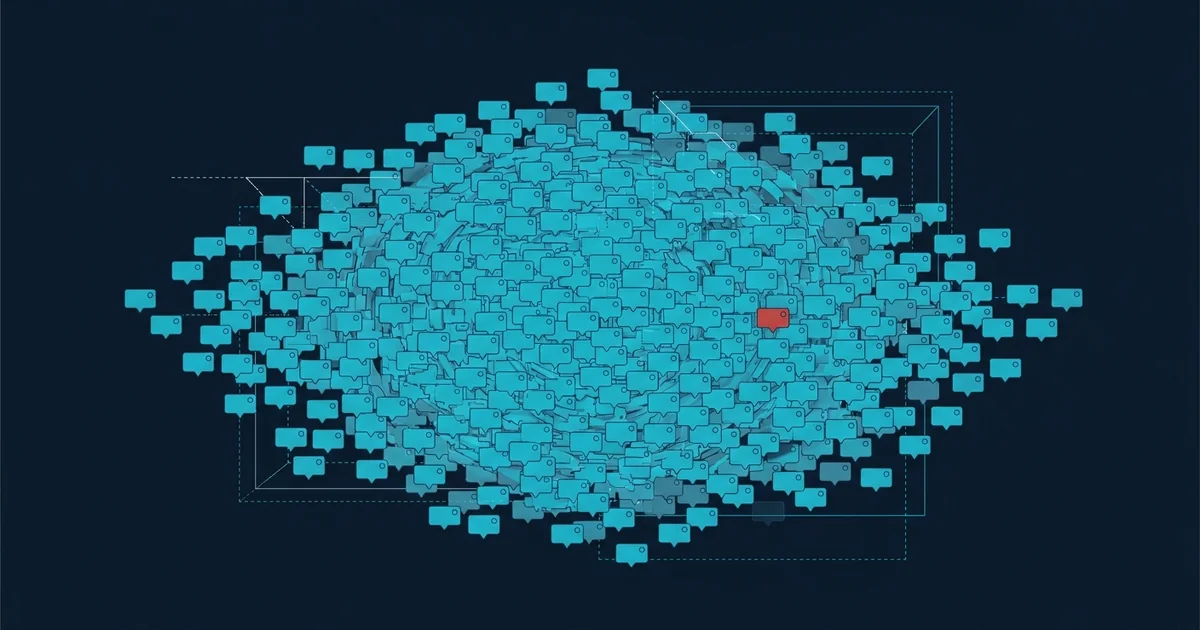
Alert fatigue is what happens when the cost of responding to alerts exceeds the value of the information in them. People stop reading. They mute the channel. They acknowledge without looking. And then the one alert that mattered arrives and is treated exactly like the four hundred that did not.
It is a design failure rather than a discipline failure, and the fix is to send fewer alerts rather than to ask people to try harder.
Nobody sets out to build a noisy system. It accumulates.
Something breaks, and an alert is added so it never surprises anyone again. That is reasonable. Repeat it for two years. Nobody removes an alert, because removing one feels like removing a safeguard, and any alert you delete is one you might regret during the next incident.
Meanwhile thresholds are set conservatively - Better to be warned early - So they fire during normal variation. And a single incident often triggers a cascade: The database alerts, and so do the twelve services that depend on it, and the load balancer, and the error rate, and the latency. One problem, fifteen notifications.
The single most effective change.
Cause-based alerting watches internals: CPU above 80%, disk above 90%, a queue longer than a thousand, memory above a threshold. Every one of those can be true while the service is completely fine, and every one can be false while it is broken.
Symptom-based alerting watches what users experience: The error rate is elevated, latency at the 99th percentile has doubled, successful checkouts have dropped. If none of those is true, it does not matter what the CPU is doing.
The practical test for any alert: If this fires and users are unaffected, should anyone have been woken? If no, it is not an alert.
Cause metrics are still worth collecting. They belong on a dashboard you look at during an investigation, not in a channel that pages people.
Every alert should be classified by what it demands, and the classification should determine the channel.
Page. Wakes a human immediately. Reserved for things that are broken for users now and will not fix themselves. If a team receives more than one or two of these a week, something is wrong.
Ticket. Needs attention today, not tonight. Certificate expiring in two weeks, disk filling at a rate that reaches full in four days, a background job that has been failing since morning.
Dashboard. Worth knowing, does not require action. Most of what is currently being alerted on belongs here.
Most teams have everything in the first tier, or everything in one channel, which amounts to the same thing.
Require duration. Alert when the error rate has been elevated for five minutes, not when a single scrape was high. Transient spikes are constant and almost never meaningful.
Require confirmation. Two consecutive failures, ideally from different locations. This eliminates most false positives at the cost of one interval of detection.
Group related alerts. When a database fails and fifteen services notice, that is one incident. Modern alerting platforms can group by cause; use it.
Suppress dependents. If the database is already alerting, do not also alert on everything that depends on it.
Delete alerts nobody acts on. Review quarterly. For each alert, ask what was done the last three times it fired. If the answer is "nothing", delete it. This is the highest-yield activity on the list and the one that feels most uncomfortable.
If an alert fires at 3am, the person responding should not be working out what it means. The alert itself should carry: What is broken in user terms, what the likely causes are, the first three things to check, and how to escalate.
The useful side effect is that writing a runbook forces the question of whether the alert is worth having. If you cannot describe what someone should do about it, it is not an alert - It is a fact, and facts go on dashboards.
Being on call is a real burden even when nothing fires: You cannot drink, cannot travel far, cannot be fully off. That cost is paid whether or not anyone is woken, and a rotation that is genuinely disruptive drives people out of a team faster than most things.
Practical measures: Rotate weekly rather than monthly, have a secondary so one person is not solely responsible, follow a night page with time off rather than a normal working day, and treat a noisy week as a bug to be fixed rather than as bad luck.
The most useful cultural rule is to track pages per shift and treat a rising number as a defect. It makes noise visible and gives whoever is suffering it the standing to fix it.
Ask the team: When an alert fires, do you look at it immediately, or do you finish what you are doing first?
If the honest answer is the second, the alerting is already not working, and no additional alert will change that. The fix is subtraction.
When so many alerts fire that people stop responding to them - Muting channels, acknowledging without reading, treating everything as noise. It is dangerous because the one alert that matters gets the same treatment as the hundreds that did not.
Usually not as a page. High CPU can be true while the service is perfectly fine and false while it is broken. Alert on symptoms users experience - Error rate, latency, failed transactions - And keep cause metrics like CPU on a dashboard for investigation.
Pages that wake someone should be rare: More than one or two a week suggests something is wrong with either the system or the alerting. Most of what teams currently alert on belongs on a dashboard instead.
Require a duration before firing, require two consecutive failures, group related alerts into one incident, suppress alerts for services that depend on something already alerting, and delete every alert nobody has acted on in the last three firings.
How to set up uptime monitoring that actually catches problems: What to check, from where, how often, and what to alert on.
What MTTR, MTBF, MTTD and MTTA actually measure, why means are misleading for incident data, and which metrics change behaviour.
Why official status pages lag user reports, how they are built, and how to read one properly - Including what a green banner does not mean.
The uptime nines table, what each level costs to achieve, and why how uptime is measured matters more than the number itself.